Ground-penetrating radar-based underground environmental perception radar for robotic system
It has been published in INTERNATIONAL JOURNAL OF ADVANCED ROBOTIC SYSTEMS (DOl: 10.1177/1729881420921642)
1. Introduction
In recent years, environmental perception technology for robotic system has attracted a lot of attention from researchers, and most of the studies on it are focused on the space above ground. With the development of computer science, there are more and more environmental perception sensors developed for robotics and artificial intelligence
In recent years, the environmental perception technology for robotic system has attracted a lot of attention from researchers, but only a little of studies on environmental perception technology are focused on the space underground. Meanwhile, in the field of mobile robotic systems, with the development of research on underground emergency hedging and buried targets' high-resolution fault imaging, more and more attention has also been paid to underground environmental detection and perception. This article proposes a ground-penetrating radar-based underground environmental perception radar (UEPR) for mobile robotic system indoors. The underground environmental perception radar can achieve noncontact and real-time perception, which helps people detect buried targets and get the image of targets more conveniently and precisely. Major contributions of this work are threefold. Firstly, a stepped frequency continuous wave modulation and demodulation scheme is proposed; secondly, a switch device for a six-channel antenna array is designed and contributed; thirdly, based on a linear antenna array and a signal processing platform, the underground environmental perception radar is supposed to achieve three-dimensional imaging in underground space indoors with its low power consumption. For the experiment of three-dimensional imaging on the copper box and underground environment indoors, the process of imaging is successful, although the size of them is a little bigger than the real size. In addition, the comparison experiment shows that the resolution of underground environmental perception radar system is similar with that of sound wave methods, and the working range of underground environmental perception radar system is deeper than the others. It can be concluded that the underground environmental perception radar can detect the copper box
Underground environmental perception, stepped frequency continuous wave, radar system, finite-difference-time-
School of Instrumentation Science and Engineering, Harbin Institute of Technology, Heilongjiang, China
2. Corresponding author:
Feng Shen, School of Instrumentation Science and Engineering, Harbin Institute of Technology, No. 92, Xidazhi Street, Nangang, Harbin, Heilongjiang 150000, China.
Email: fshen@hit.edu.cn fields, including radio frequency identification (RFID) with its sensors networks,,
In vision-based technologies, the camera is a powerful sensor for capturing the images in robot vision and building the map for environments.
Meanwhile, with the development of research on underground emergency hedging and buried targets' fault detection, more and more attention has also been paid to underground environmental detection and perception. However, compared with a variety of detection and perception methods for the space above ground, the technical means are limited for underground environmental detection and perception. Until now, there have been three effective ways, including a way based on electromagnetic technology, Internet of things (IoTs) technology, and seismic (Rayleigh) waves.
For underground detection, the electromagnetic-based technology now is the most effective way to achieve noncontact detection for the features underground. As a typical equipment for underground detection, ground-penetrating radar (GPR) has been widely used in a lot of fields. For example, early on, the GPR is usually used to detect targets underground, like pipeline networks and antipersonal land mine.
For achieving underground perception, there have been three methods proposed in recent years. The first method is based on IoT technology, which is a core technology to specialize in underground model building for the mine IoT.
Compared with the other two methods, the UEPR method has some irreplaceable advantages. With realtime and noncontact detection, this method can also achieve high imaging resolution and higher detection speed. Besides, the GPR-based UEPR method can achieve deep detection depth without losing the other methods. Therefore, the advantages above promote the application of GPR-based UEPR method in the field of mobile robotic system indoors. Recently, the technology related to ultrawideband (UWB) radar has been introduced for some applications indoors, like human detection and tracking,
As a result, for buried targets' noncontact detection and real-time imaging indoors, a GPR-based UEPR system, which can be loaded on a mobile robotic system indoors, is proposed in this article. Based on a linear antenna array and a signal processing platform, the UEPR can be loaded on indoor robotic system and can achieve threedimensional (3-D) imaging in underground space indoors. In addition to improving imaging resolution and detection speed, the 3-D imaging function of UEPR system can greatly improve the intuitiveness of detection results. Major contributions of this work are threefold. Firstly, in order to sample the UWB signals using an A/D conversion with relatively low sampling rate, we propose a stepped frequency continuous wave (SFCW) modulation and
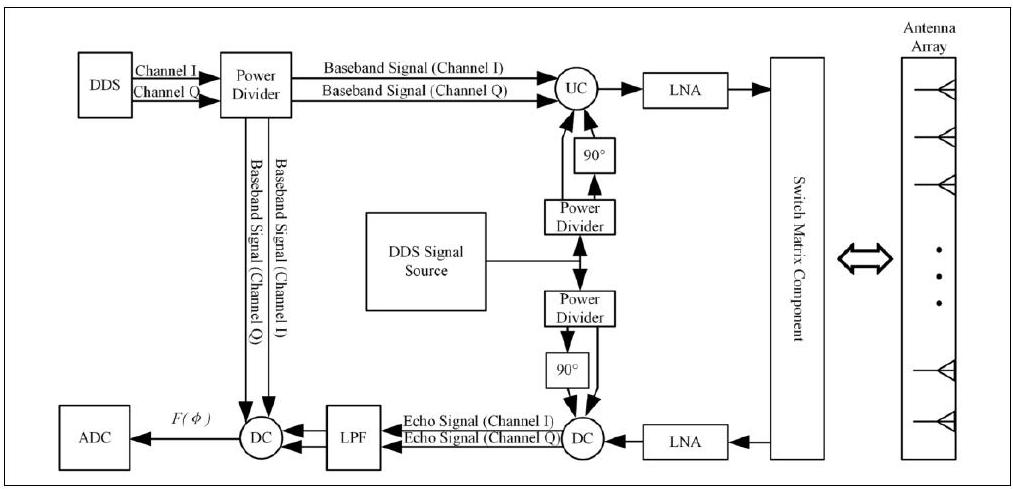
Figure I. The structure of SFCW modulation and demodulation with switch matrix component and antenna array. SFCW: stepped frequency continuous wave.
demodulation scheme. Then, we design a switch device for a six-channel antenna array to achieve the linear scan of signal channels. At last, an experimental study is performed to confirm that UEPR can be loaded on indoor robotic system with its low power consumption and can achieve 3 -D imaging in underground space indoors.
3. Theoretical analysis on GPR-based UEPR
The UEPR system aims at achieving 3 -D imaging for the target underground. Concretely, the whole working process of UEPR system basically consists of the following parts: The part of hardware is shown in Figure 1, where the structure of SFCW modulation and demodulation with switch matrix component and antenna array is elaborated. In this part, the modulated and received SFCW, which consist of 1-MHz local oscillator (LO) signal and linear sweeping baseband signal, both sweep from
In this section, in order to elaborate the whole working process of UEPR system, the basic theory of the system is supposed to introduce from the following three aspects.
4. Analysis on GPR-based perception in underground space
To achieve GPR-based perception in the space underground, we firstly simulate the process of electromagnetic
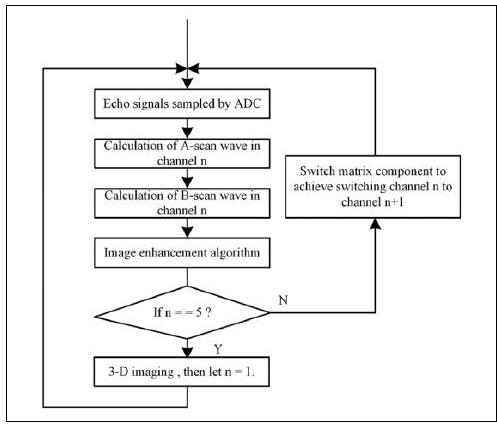
Figure 2. The processing of 3-D-imaging. 3-D: three-dimensional.
propagation using gprMax with the method of finitedifference time-domain (FDTD). The basic information of FDTD for GPR modeling can be found in the literature.
The electromagnetic propagations, on a macroscopic scale, can be described by the following Maxwell's equations, which express the relations between the fundamental electromagnetic field quantities and the dependence on their sources using first-order partial differential equations.
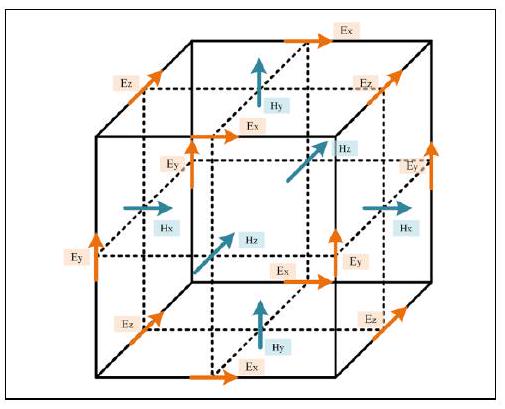
Table I. Parameters of the UEPR system.
| Parameters | Value |
| Solving domain | |
| Central frequency | |
| Time window | |
| Size of underground space | |
| Target's geometry center | |
| Tx antenna initial position | |
| Rx antenna initial position | |
| The steps along Z-axis direction | |
| The number of steps along Z-axis | 5 |
| The steps along X-axis direction | |
| The number of steps along X-axis | 20 |
UEPR: underground environmental perception radar.
Figure 3. 3-D FDTD Yee cell. 3-D: three-dimensional; FDTD: finite-difference time-domain.
where
where
According to the analysis above, we set the value of parameters in this simulation, which are listed in Table
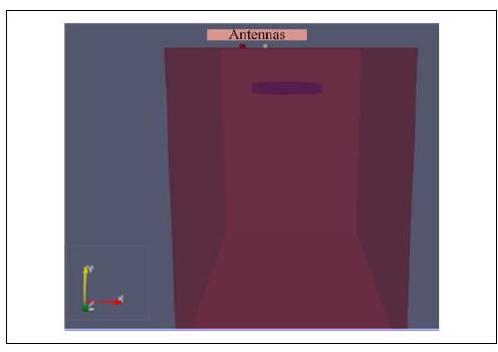
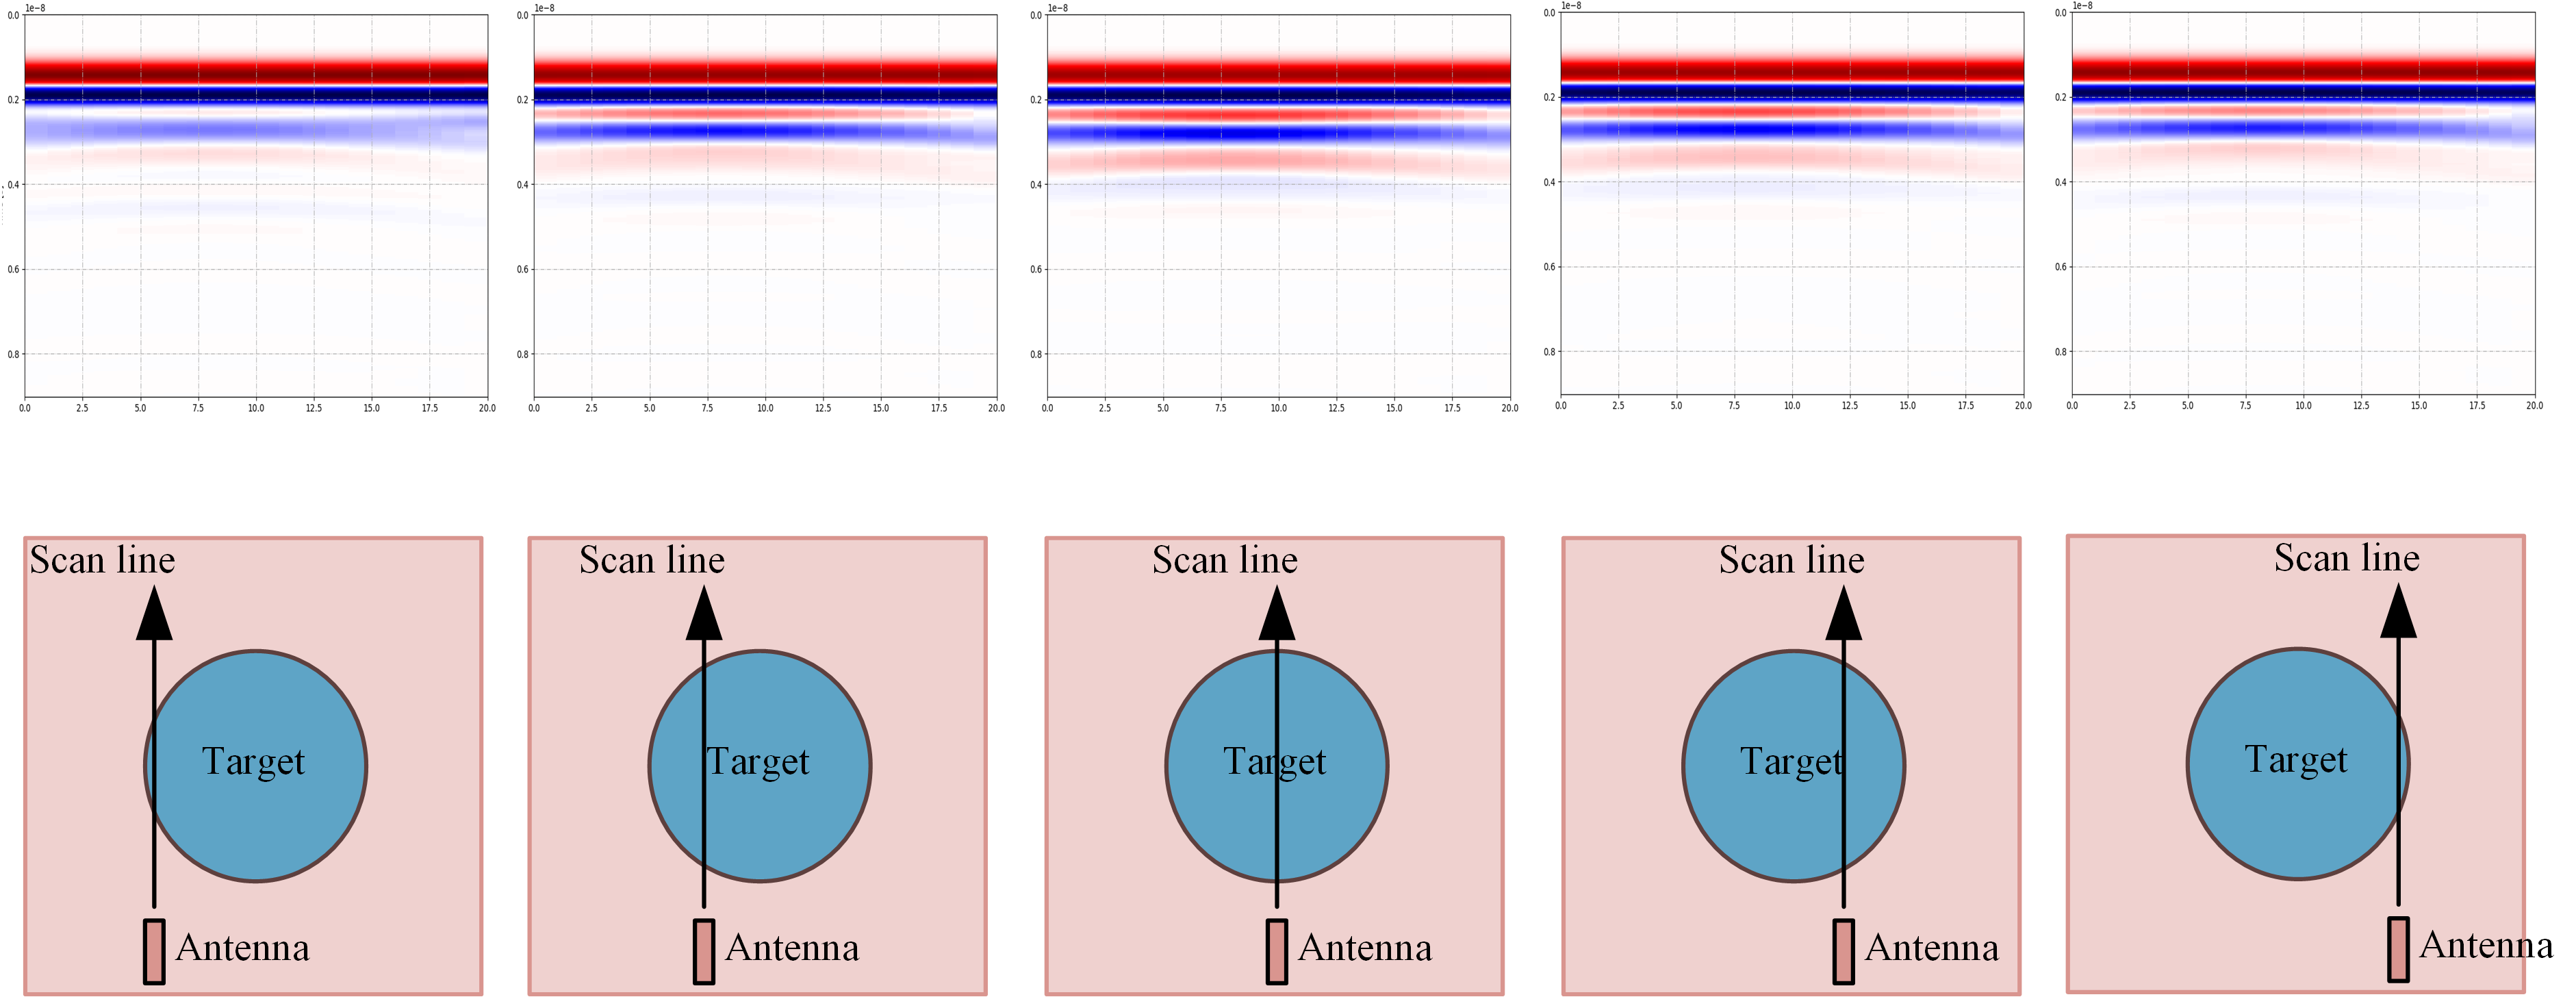
Figure 4. The simulated 3-D environment with a red underground space, a blue mental target and a couple of antennas. 3-D: three-dimensional
the middle path is the largest. Moreover, the
5. Study on SFCW modulation and demodulation
The dielectric consists of bricks and cement in underground environment indoors. To achieve high resolution and large detection range, it is necessary to modulate and transmit UWB SFCW signals to the ground. On the other hand, depending on the sampling rate of

Figure 5. The simulated results in different paths.
where
where
Then, we make
where
As shown in equations (9) and (10),
If the target is at rest, the velocity
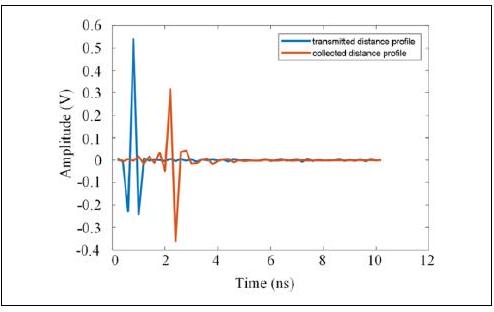
Figure 6. We measure the transmitted distance profile in blue and the collected distance profile in red using UEPR system. UEPR: underground environmental perception radar.
where
Based on theory above, we measure the transmitted and collected distance profile
6. Study on switch strategy of signal channels
To achieve antenna array linear scan with a set of signal chain, we design an RF switch matrix using a group of component combination including two single-pole-sixthrow switches and six single-pole-two-throw switches. The topological structure of the switch matrix is shown
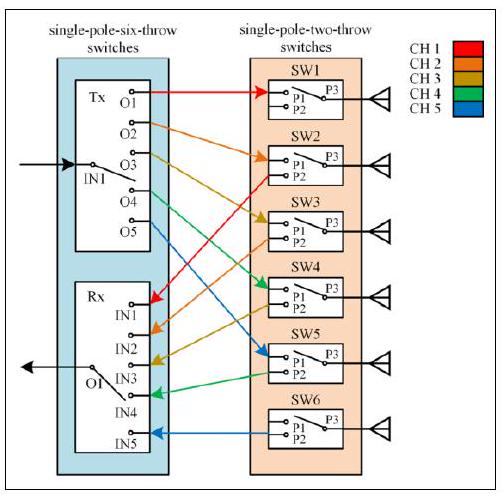
Figure 7. The topological structure of the switch matrix where the five colors represent five different channels.
Table 2. The truth table of the decoder for channel switch controlling.
| Channel | Bits [23:16] | Bits [15:8] | Bits [7:0] |
| 1 | 00000001 | 01011001 | 01010101 |
| 2 | 00000000 | 01000110 | 01010101 |
| 3 | 00000010 | 01100101 | 10010101 |
| 4 | 00000000 | 10010101 | 01100101 |
| 5 | 00000010 | 10000101 | 0101001 |
| Default | 00000011 | 11110101 | 01010101 |
in Figure 7, where the five colors represent five different channels. More concretely, the signal chain starts with TxSW1-SW2-Rx in red and sweeps to Tx-SW5-SW6-Rx in blue, which creates five channels of data. Every channel has its unique number for accurately channel switch controlling. For example, when channel 1 (Tx-SW1-SW2-Rx) is enabled, port IN1 is connected with port O1 in Tx model and
| Parameters | Value |
| Bandwidth | |
| Size | |
| Transmitted power | |
| ADC sampling rate | |
| ADC sampling size | 12 bits |
| DAC sampling rate | |
| DAC sampling size | 14 bits |
| Stepped frequency |
|
| SFCW time width |
|
| Initial frequency fo |
UEPR: underground environmental perception radar; SFCW: stepped frequency continuous wave.
In addition, every channel would be held for
7. Experiment and discussion
In this section, we make an experimental platform which can be loaded on robotic system indoors, and the parameters of this platform are listed in Table 3 . As is shown, its small size determines that the system is able to be loaded on mobile robot platform and work in a narrow space. Then, we take the three experiments: The first one, as shown in Figure 8(a), is the detection for a copper box; the second one, as shown in Figure
For the first experiment, both the detection area and the target are marked in red, where the big one is the area, and the small one is the target. We scan the area and collect the echo signals using the UEPR platform. Then, there are five B-scan pictures produced with direct-coupled wave only. To extract the characteristic echo wave, we make some improvements for a histogram equalization algorithm and enhance the B-scan pictures using the improved algorithm. Figure 8 (b) shows the results of five channels before and after enhancement. We replace these five enhanced pictures as the arrow, as shown in Figure
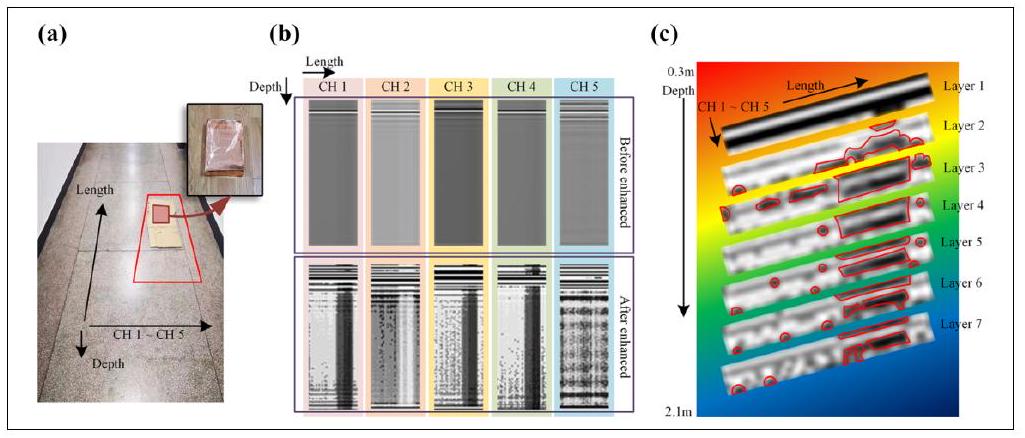
Figure 8. (a) The experimental environment of copper box detection. (b) The collected signals of five channels before and after enhanced. (c) Seven layers of underground environment in copper box detection.
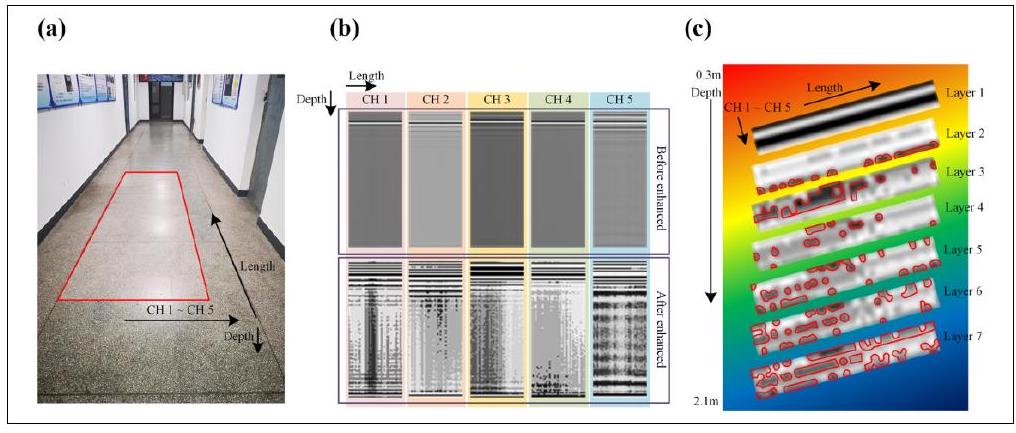
Figure 9. (a) The experimental environment of a realistic underground space indoors. (b) The collected signals of five channels before and after enhanced. (c) Seven layers of underground environment in experiment of the detection for realistic underground space indoors.
collected. As is marked in red lines, the image of target is similar to a rectangle in layers 3 and 4 . However, in layers
To detect realistic underground space indoors, for the second environment, without any special target, the detection area is also marked in red. We scan the area and collect the echo signals using the UEPR platform. Then, there are also five B-scan pictures produced with direct-coupled wave only. After the enhancement, the characteristic echo wave is extracted with the help of improved algorithm. Figure
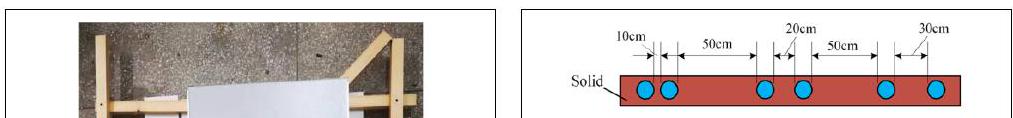
Figure 13. The distribution of six mental balls.
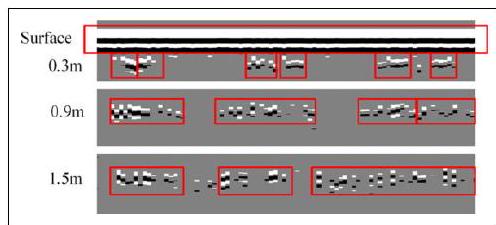
Figure 10. The experimental platform for robotic system.
Figure 14. The image in different depth.
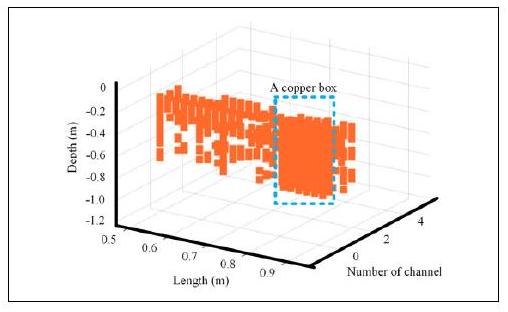
Table 4. The resolution comparison between the UEPR and other method in different depth.
| Depth | The UEPR | A sound wave method |
| Out of range |
UEPR: underground environmental perception radar.
Figure II. The 3-D image of the copper box. 3-D: threedimensional.
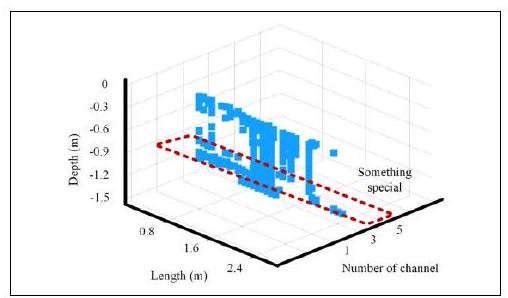
Figure I 2. The 3-D image of the environment underground. 3-D: three-dimensional.
On the basis of experimental results above, in the last experiment, the resolution of the UEPR system is analyzed. First of all, we improve the experimental platform to meet the requirements of this comparison experiment. Specifically, as shown in Figure 13, there are six metal balls with
Combining the above experimental results, the resolution of UEPR in different depth is shown in Table
In a word, the GPR-based UEPR system is able to achieve underground environmental perception indoors in a narrow working space. In addition, the comparison experiment shows that the resolution of UEPR system is similar with that of sound wave methods, and the working range of UEPR system is deeper than the others. However, in these two 3-D imaging, the size of imaging target is a little bigger than the size of real target. This problem is supposed to be improved in future research.
8. Conclusion
The environmental perception technology for robotic system has attracted a lot of attention from researchers recently, but only a little of studies on environmental perception technology are focused on the space underground. In this article, a GPR-based UEPR for mobile robotic system indoors is proposed. Major contributions of this work include three functions: Firstly, an SFCW modulation and demodulation scheme is proposed; secondly, a switch device for a six-channel antenna array is designed and contributed; thirdly, based on a linear antenna array and a signal processing platform, the UEPR is supposed to achieve 3-D imaging in underground space indoors with its low power consumption. For the experiment of
9. Declaration of conflicting interests
The author(s) declared no potential conflicts of interest with respect to the research, authorship, and/or publication of this article.
10. Funding
The author(s) disclosed receipt of the following financial support for the research, authorship, and/or publication of this article: This work was supported by the National Natural Science Foundation of China [61673128, 61573117, and 41627801] and the Natural Science Foundation of Heilongjiang Province [F2015031].
11. ORCID iD
Yuxuan Wu (DD https://orcid.org/0000-0001-9377-0685
12. References
-
Baeg SH, Park JH, Koh J, et al. Building a smart home environment for service robots based on RFID and sensor networks. In: 2007 International conference on control, automation and systems. IEEE, Seoul, South Korea, 17-20 October 2007, pp. 1078-1082.
-
Enriquez
, Park S, and Hashimoto . Wireless sensor network and RFID sensor fusion for mobile robots navigation. In: 2010 IEEE international conference on robotics and biomimetics. IEEE, Tianjin, China, 14-18 December 2010, pp. 1752-1756. -
Chen J, Tian S, Xu H, et al. Architecture of vehicle trajectories extraction with roadside lidar serving connected vehicles. IEEE Access 7: 100406-100415.
-
Tan
, Bin Shaiful DS, Ang WJ, et al. Design optimization of sparse sensing array for extended aerial robot navigation in deep hazardous tunnels. IEEE Robot Autom Lett 2019; 4(2): 862-869. -
Stanislas L and Dunbabin M. Multimodal sensor fusion for robust obstacle detection and classification in the maritime robot challenge. IEEE J Oceanic Eng
: 343-351. -
Zhao
, Wang , Lin , et al. On-road vehicle trajectory collection and scene-based lane change analysis: Part I. IEEE Trans Intell Transport Syst 2016; 18(1): 192-205. -
Xie S, Yang D, Jiang K, et al. Pixels and 3-D points alignment method for the fusion of camera and lidar data. IEEE Trans Instrum Meas 2019; 68: 3661–3676.
-
Yu H, Fu Q, Yang Z, et al. Robust robot pose estimation for challenging scenes with an RGB-D camera. IEEE Sensor
2018; 19(6): 2217-2229. -
Tsai CY and Tsai SH. Simultaneous 3-D object recognition and pose estimation based on RGB-D images. IEEE Access 2018; 6: 28859-28869.
-
Valls A, Garca F, Ramrez M, et al. A combined use of GPR data with historical archives for identifying pavement construction periods of Valencian silos (16th century, Spain). IEEE J Sel Top Appl Earth Obs Remote Sens 2015; 9(1): 98-107.
-
Ali MA and Mailah M. Path planning and control of mobile robot in road environments using sensor fusion and active force control. IEEE T Veh Technol 2019; 68(3): 2176-2195.
-
Zhang
, Reardon , and Parker LE. Real-time multiple human perception with color-depth cameras on a mobile robot. IEEE Trans Cybern 2013; 43(5): 1429-1441. -
Sharma KD, Chatterjee A, and Rakshit A. Experimental study ii: vision-based navigation of mobile robots. Intelligent Control. Berlin: Springer, 2018, pp. 243-280.
-
Zhao S and Fang Z. Direct depth SLAM: sparse geometric feature enhanced direct depth SLAM system for low-texture environments. Sensors 2018; 18(10): 3339 .
-
Birem M, Kleihorst R, and El-Ghouti N. Visual odometry based on the Fourier transform using a monocular groundfacing camera. J Real-Time Image Pr 2018; 14(3): 637-646.
-
Yang
and Yoo SJ. Optimal UAV path planning: sensing data acquisition over IoT sensor networks using multiobjective bio-inspired algorithms. IEEE Access 2018; 6: 13671-13684. 17. Milella A and Reina G. Adaptive multi-sensor perception for driving automation in outdoor contexts. Int J Adv Robot Syst 2014; 11(8): 135 . -
Kong J, Ding M, Li X, et al. An algorithm for mobile robot path planning using wireless sensor networks. In: 2015 IEEE international conference on mechatronics and automation, Beijing, China, 2-5 August 2015, pp.2238-2242.
-
Sole A, Mano O, Stein GP, et al. Solid or not solid: vision for radar target validation. In: IEEE Intelligent Vehicles Symposium, 2004. IEEE, Parma, Italy, Italy, 14-17 June 2004, pp. 819-824.
-
Ji Z, Luciw M, Weng J, et al. Incremental online object learning in a vehicular radar-vision fusion framework. IEEE T Intell Transp Syst 2010; 12(2): 402-411.
-
Wu S, Decker S, Chang
, et al. Collision sensing by stereo vision and radar sensor fusion. IEEE T Intell Transp Syst 2009; 10(4): 606-614. -
Fukada T, Hasegawa Y, Kawai Y, et al. GPR signal processing with geography adaptive scanning using vector radar for antipersonal landmine detection. Int J Adv Robot syst 2007 ; 4(2): 199-206.
-
Redman JD, Hans G, and Diamanti N. Impact of wood sample shape and size on moisture content measurement using a GPR-based sensor. IEEE J Sel Top Appl Earth Obs Remote Sens 2016; 9(1): 221-227.
-
Jonard
, Weihermuller , Jadoon , et al. Mapping fieldscale soil moisture with l-band radiometer and groundpenetrating radar over bare soil. IEEE Trans Geosci Remote Sens 2011; 49(8): 2863-2875. -
Wang J, Guo Y, Jia Y, et al. Modeling and application of the underground emergency hedging system based on Internet of things technology. IEEE Access 2019; 7: 63321-63335. 26. Bulletti A, Borgioli G, Calzolai M, et al. Acoustoseismic method for buried-object detection by means of surfaceacceleration measurements and audio facilities. IEEE Trans Geosci Remote Sens 2010; 48(8): 3134-3138.
-
Sugimoto
and Hiraku K.Resolution improvement of shallow underground imaging using super-magnetostriction vibrator and pulse compression method. In: 2008 IEEE International Ultrasonics Symposium Proceedings. IEEE, Beijing, China, 2-5 November 2008, pp. 1889-1892. -
Sugimoto
and Hiraku . Study on the shallow underground imaging by the pulse compression method that considered frequency dependent attenuation. In: 2009 IEEE International Ultrasonics Symposium Proceedings. IEEE, Rome, Italy, 20-23 September 2009, pp. 1463-1466. -
Zhou X, Chen H, and Li J. An automatic GPR B-scan image interpreting model. IEEE Trans Geosci Remote Sens 2018; 56(6): 3398-3412.
-
Chang
, Wolf , and Burdick JW. Human detection and tracking via ultra-wideband (UWB) radar. In: 2010 IEEE international conference on robotics and automation. IEEE, Anchorage, AK, USA, 3-7 May 2010, pp. 452-457. -
Warren C, Giannopoulos A, and Giannakis I. Girmax: open source software to simulate electromagnetic wave propagation for ground penetrating radar. Comput Phys Commun 2016; 209: 163-170.
-
Giannopoulos A. The investigation of transmission-line matrix and finite-difference time-domain methods for the forward problem of ground probing radar. PhD Thesis, University of York, UK, 1998 .
-
Kunz KS and Luebbers RJ. The finite difference time domain method for electromagnetics. Boca Raton: CRC Press,
Recommended for you
The use of Mathpix OCR with EDICO scientific editor to help blind Students in STEM education
The use of Mathpix OCR with EDICO scientific editor to help blind Students in STEM education
In this tutorial we'll show how Mathpix OCR is helpful to instantly transpose math and science assignments both in braille and speech. We'll use the free EDICO Scientific Editor to demonstrate how a math assignment can be imported using Mathpix technology, and how it can be solved using a Refreshable Braille Display.